
I hope everyone had a happy 4th of July and that as many of you as possible were able to stretch the holiday into a long summer weekend! I was lucky enough to be with my family on a tiny little lake on the border between New Hampshire and Maine. A beautiful thing about this tiny border lake is, being co-jurisdictional between two states, it hasn’t had a documented police presence in decades. It is one of the “free-est” places on earth in that regard (and a great place to launch fireworks). As evening descended on the 4th, many a lake-dweller saluted our great nation with a tribute of multi-chromatic gunpowder. My three junior Sector ETF Operators saw their regular bedtime transformed into a celebratory re-enactment of artillery volleys on all sides of the lake leaving smoke floating across the water for hours after.
Hot dogs, Hamburgers, Fireworks, Boats and Beer are but a few great things we Americans have highlighted for the world’s pleasure. However, one thing under-appreciated at this time might be the wealth generating power of the American financial markets and our economy. I can’t help but spare a thought at these times for the brave young men who did prowl similarly wooded lands between lake, bog and fen stalking their colonial oppressors so that we could secure our fortune free of tyranny 200+ years and many bull markets ago. Those whom we now celebrate by lighting off enormous fusillades of fireworks at $40-60 a box for 60-90 seconds of sound and fury per serving. They sacrificed so we may thrive and in many indubitable respects thrived we have!!
It is in the defense of our shared prosperity that I write my current market missive. I have seen, somewhat to my dismay, that the Cassandras of the market are calling out a “Bubble” in our share prices. The likely culprits of this cycle are well known to us all (at least 7 of them are), but what always fades with the passage of time is the culprits of the past and the crimes of greed they committed that are now the fodder of comparison. I speak of the “Tech Bubble” of the late 1990’s and/or the “Tech Wreck” of the early 2000’s. They are of course two sides of the same coin, but if we are to use them as a basis to make investment decisions today, we should at least give them some scrutiny at a high level to understand the comparison. Hopefully surprising no one, we will go at this from a sector perspective! Read on for the ETFsector.com view on whether we are in a new iteration of the “Tech Bubble”.
–Patrick Torbert, CMT | Chief Strategist, ETFsector.com
ETF’s/The Week in Review
What’s Hot!
Sectors
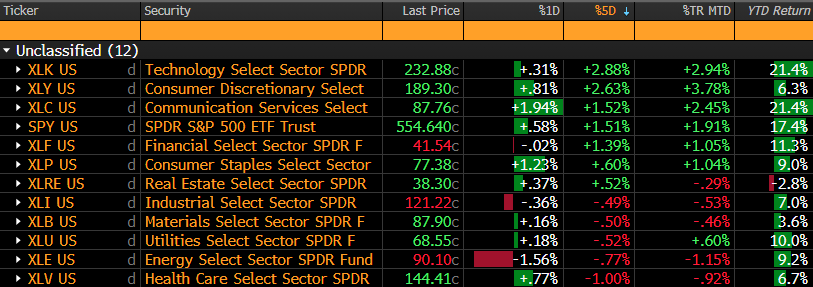
Our 2024 “Usual Suspects” reclaimed leadership over the holiday-shortened week. XLK and XLC continue to be the loan sector level outperformers vs. the S&P 500. Discretionary (XLY) has shown some follow-through from last month and (XLF) is really the only other sector showing any life in the near term. This lack of broad participation is a point of concern for the “Bubble” crowd. Narrowing market breadth typically does precede major price declines historically and we are seeing negative breadth divergence on the S&P 500’s %Above50day and %Above200day moving average series which are measures of trend breadth. However, given the undeniable Mega Cap. nature of the advance these outputs are not surprising.
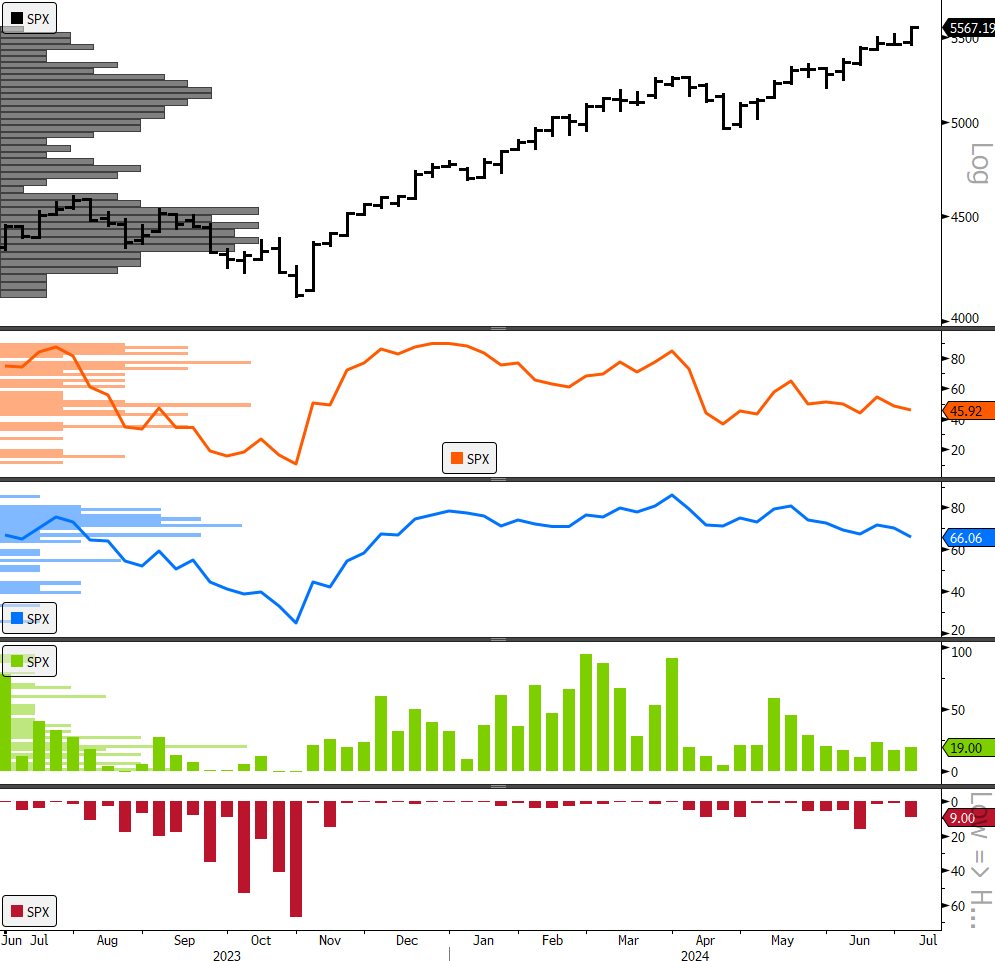
- S&P 500
- % of Members ABOVE 50-day moving average
- % of Members ABOVE 200-day moving average
- 52-wk new highs | 52-wk new lows
Casting a wider net and looking at all NYSE stocks shows a slightly more bullish picture for the average stock. The Bloomberg/NYSE cumulative advance/decline line which accumulates the value of (# of NYSE advancing stocks – # of NYSE declining stocks) since 7/16/2004, has persisted in an uptrend over the past 12 months despite a pull-back from its YTD high in May while 56.8% of NYSE stocks remain above their respective 200-day moving averages.
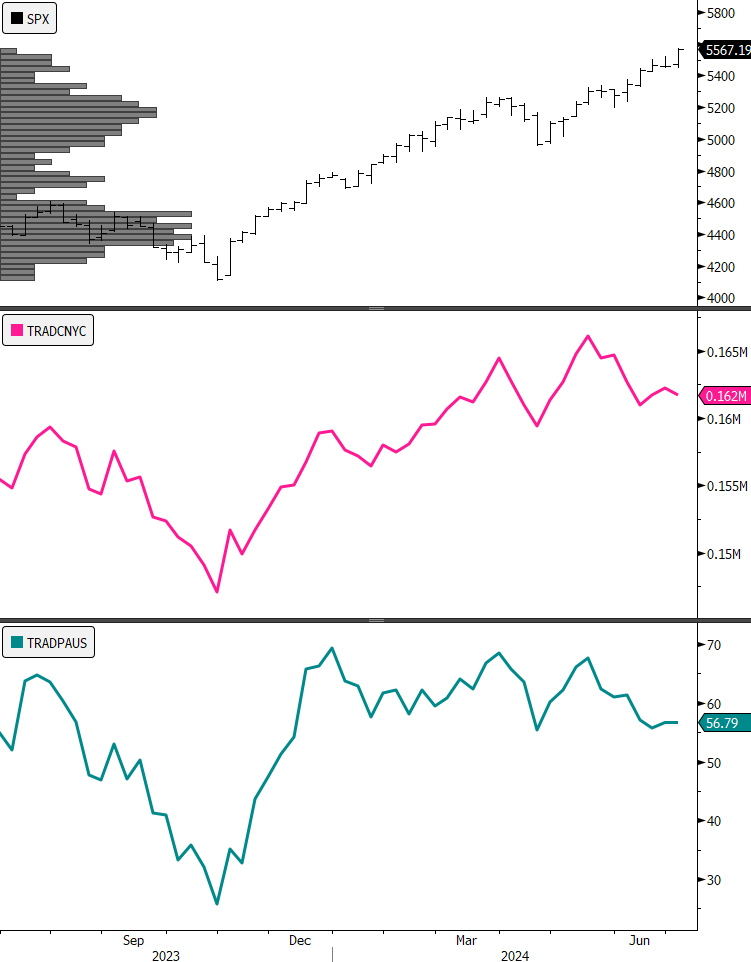
- S&P 500
- Bloomberg NYSE Cumulative Advance/Decline Line
- Bloomberg % of NYSE stocks closing above their 200-day moving average
We would conclude market breadth is at a potential pivot point but is not an outright caution just yet. We’d also point out that any potential broadening of upside participation likely would come at the expense of present leadership, so it’s an interesting potential paradox that a chief concern of the bear is the absence of a better alternative when the emergence of such would likely cause some selling in the present leadership cohort.
Are we in a “Tech Bubble” right now?
There is no factual basis to dispute that only two of our 11 GICS sectors have been sources of alpha (in aggregate) for the past 10 years from a simple return, buy and hold perspective, but does this constitute an asset bubble? At its core, the idea of a bubble is grounded in irrationality. The fabled “Tulip Mania” of 16th century Holland is often cited as an example of such, though the sensationalism of the story diminishes as one researches and applies standard textual criticism to the sources (there are few and the principal source is a satire). Our Tech. Bubble of the late-990’s certainly qualifies as an irrational dislocation in resource allocation as speculative dollars did in fact chase concepts that were years away from being profitable, if not outright obsolescence (Hi, PalmPilot!). The Nikkei “Bubble” of the 1980’s is another example, where real estate and equity values far outpaced the utility of the underlying assets (at one point the Japanese Imperial Grounds in Kyoto were valued at a higher price than the entire island of Manhattan).
As for today, hindsight may eventually reveal that we have engaged in too much AI exuberance, Cloud computing exuberance or EV exuberance, but a look at the performance trends shows we haven’t engaged in the kind of wild run-ups in price that were present in the late 90’s. It’s been a more deliberate and sober brand of exuberance if exuberance it is. The wild metrics (price/sales, price/page-views anyone?) have not materialized. Earnings are accruing to the Tech sector at a rapid rate, but they are real “hay in the barn” earnings so far as we know. Here are the charts.
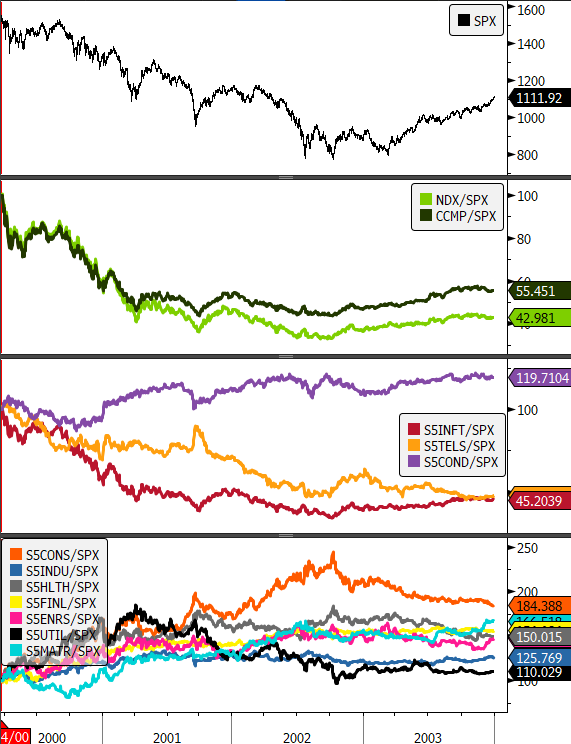
The 2000 Tech Bubble (In Sectors): Inflating the Bubble, 1997-2000
From January of 1997 through March of 2000, the Nasdaq 100 (NDX) outpaced the S&P 500 by 3x. The broader Nasdaq composite outperformed by 2x. During that time only two of the other 9 GICS sectors outperformed on a capital return basis and both of those (Telecom, Discretionary) only by pedestrian levels (+12%, +9% respectively). All of our traditional defensive and cyclical sectors underperformed in that 3-year period while the Tech. Sector more than doubled (2.4x the market return for the sector).
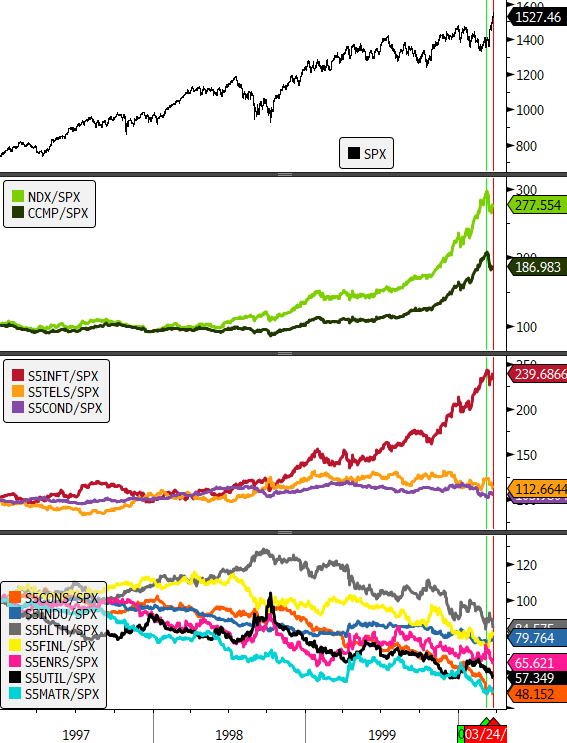
- S&P 500, daily, January 1, 1997 – March 24, 2000
- Panel 2: NDX, CCMP (Indexed to 100)
- Panel 3: Outperforming sectors
- Panel 4: Underperforming sectors
Of note, commodities sectors were particularly out of favor as the Tech Bubble came at the end of the “Commodities Super-Cycle” Bear phase (a topic for a future note!) where Crude prices had languished for more than a decade and the US had offshored much of its energy production.
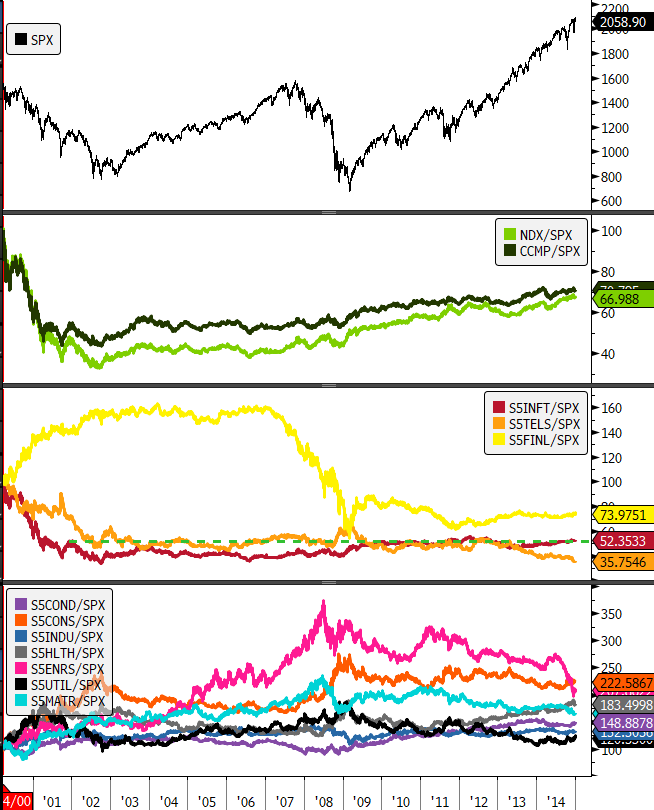
Part 2: The Bursting (2000-2003)
On March 10, 2000, the NASDAQ peaked at 5,048.62, marking the height of the bubble. Shortly after, there was a significant shift in market sentiment. By the end of 2000, the NASDAQ had fallen by nearly 50% from its peak. In April 2000, tech giant Microsoft faced an antitrust ruling that led to a sharp decline in its stock price. Additionally, companies like Cisco and Intel issued profit warnings, further eroding investor confidence. The downturn continued into 2001, with the index eventually losing more than 75% of its value from the March 2000 high.
Unlike traditional recession driven bear markets, this one saw a broad range of sectors outperform the benchmark S&P 500 regardless of their historical volatility profile. Energy, Materials, Industrials, Consumer…everything but Info Tech. and Telecom. Outperformed during the multi-year bear market.
- S&P 500, daily, March 24, 2000 – January 1, 2004
- Panel 2: NDX, CCMP (Indexed to 100)
- Panel 3: Former Outperforming Sectors (Discretionary was a consistent outperformer)
- Panel 4: Former Underperforming Sectors (All above the Benchmark over the 3yr+ period)
The Aftermath: More than a decade in the wilderness
In my past life doing research for mutual funds, I did a study on speculative cycles. The aforementioned Tech. and Nikkei Bubbles, Crude in the 1970’s, the Thai Baht in the late 1990’s, Homebuilders in the 00’s, Global Mining into 2008…. You get the idea. The TL: DR version of that work is that it typically takes around 10 years for assets, or markets that have experienced the epicenter of a speculative boom/bust cycle to start being able to sustainably outperform again. The S&P 500 Information Technology Sector “based” or moved sideways over a prolonged period after busting up between 2000-2003. Even as the Nasdaq 100 and Nasdaq Composite gain back some share of capital in the years after with the emergence of the new generation of Growth titans, the Tech. sector was fallow well into the 2010’s and even underperformed the Financial Sector despite its own securitization driven meltdown in 2008-09.
- S&P 500, daily, March 24, 2000 – January 1, 2015
- Panel 2: NDX, CCMP (Indexed to 100)
- Panel 3: Tech and Telecom are Secular Laggards
- Panel 4: The Tech Bubble gave way to a Commodities price boom
So, What About Today?
In our last market letter (Narrations of a Sector ETF Operator | Weekly Market Letter, June 23, 2024 – ETF Sector) we talked about “Secular” bull markets and did some comparisons of the present cycle to those completed cycles of the past. In that context, we would expect a speculative bubble to occur at the end of a secular advance. That previous analysis, though of the “50,000-foot view” variety came out against this being a likely final phase of the secular advance. This note offers some further insight into the relative performance of the sectors as well as earnings and valuation comparison at a high level.
The chart below shows sector relative performance vs. the S&P 500 over the past 10-years. This period encompasses almost the entirety of this proposed 2nd generation “Tech Bubble”. We can see over the 10 years the Sector has outpaced the S&P 500 by 2.1x. This is a far cry from the 2.4x the sector lapped the S&P 500 in just over 3 years from 1997 to the peak in March 2000. We do note, the lack of success from the other 11 sectors on a capital basis, but given some of the relative earnings growth that has manifested over the past 30 years it is hard to claim irrationality here.
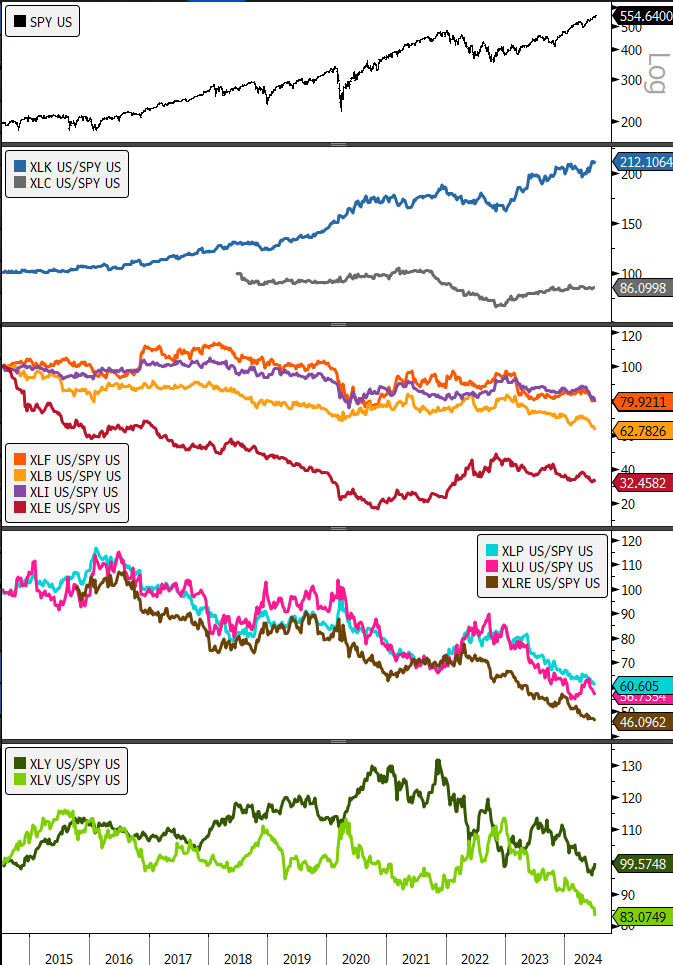
- SPY, daily, July 7, 2014 – July 7 2024
- Panels 2-4: Sectors SPDR’s Relative to SPY
A Look at the Fundamentals
Below is a very ugly but nonetheless poignant chart showing the price of the S&P 500 Info Tech. Sector and its price along with its Adjusted Price / Estimated Earnings Ratio on an annual basis from 1996-2024. The current P/E for the Sector is around 34x vs. a bubble peak of >60x.
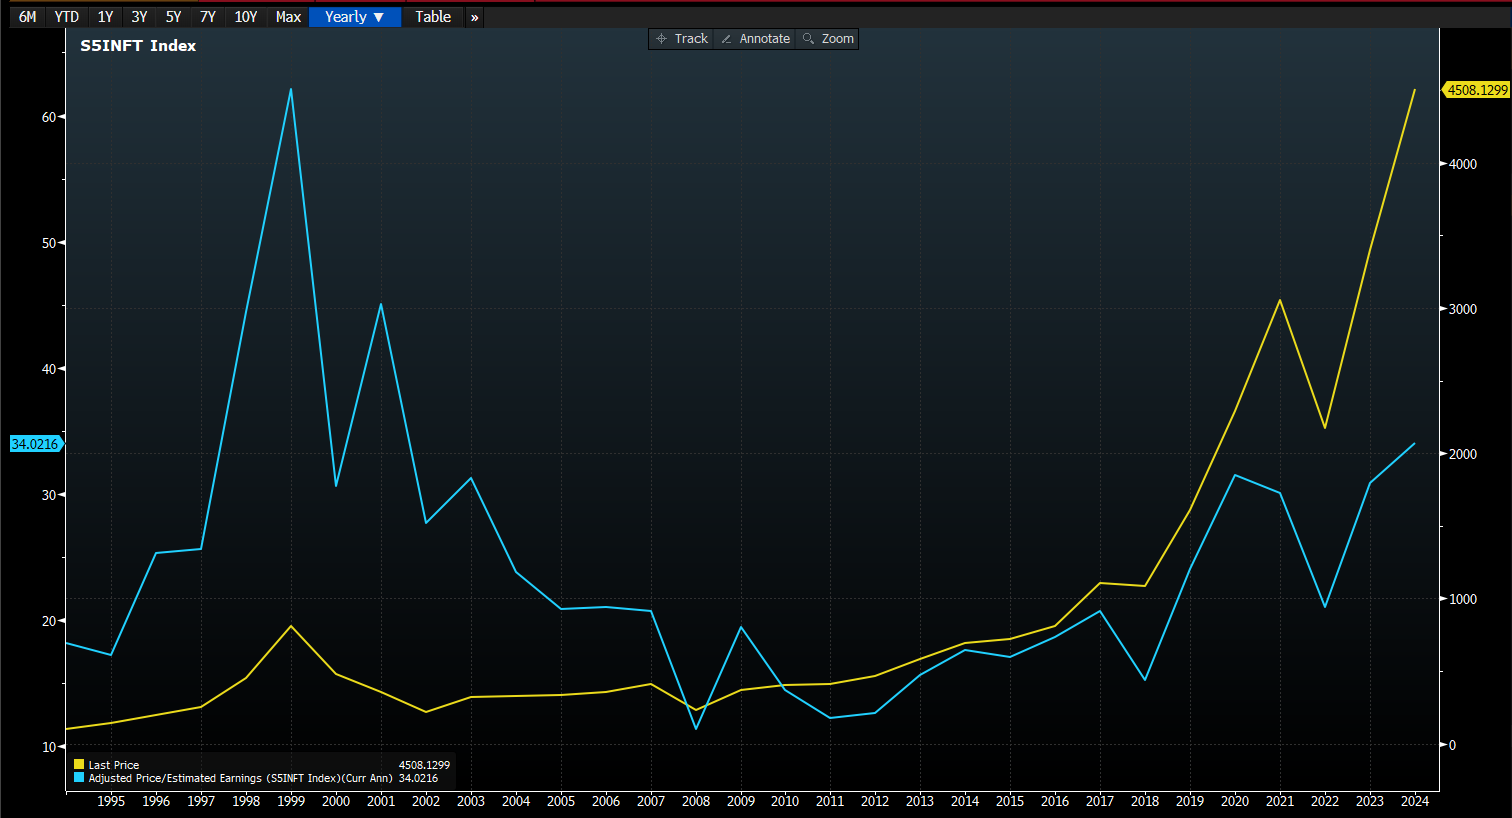
- S&P 500 Info Tech Sector P/E
- S&P 500 Info Tech Sector Price (Yearly, 1994-2024)
The chart that really struck us when we were looking around our Bloomberg terminal was this one. The Tech. Sector currently comprises >50% of the total aggregate earnings per share of the S&P 500 Index and that percentage is forecast to grow to near 65% over the coming years. With forward earnings growth of around 9% projected for the sector, strength abounds. We don’t see the broad setup for a speculative bust at this point. If anything, it appears we are in a longer-term cycle where any slow-down or correction in these shares will be seen as an accumulation opportunity.
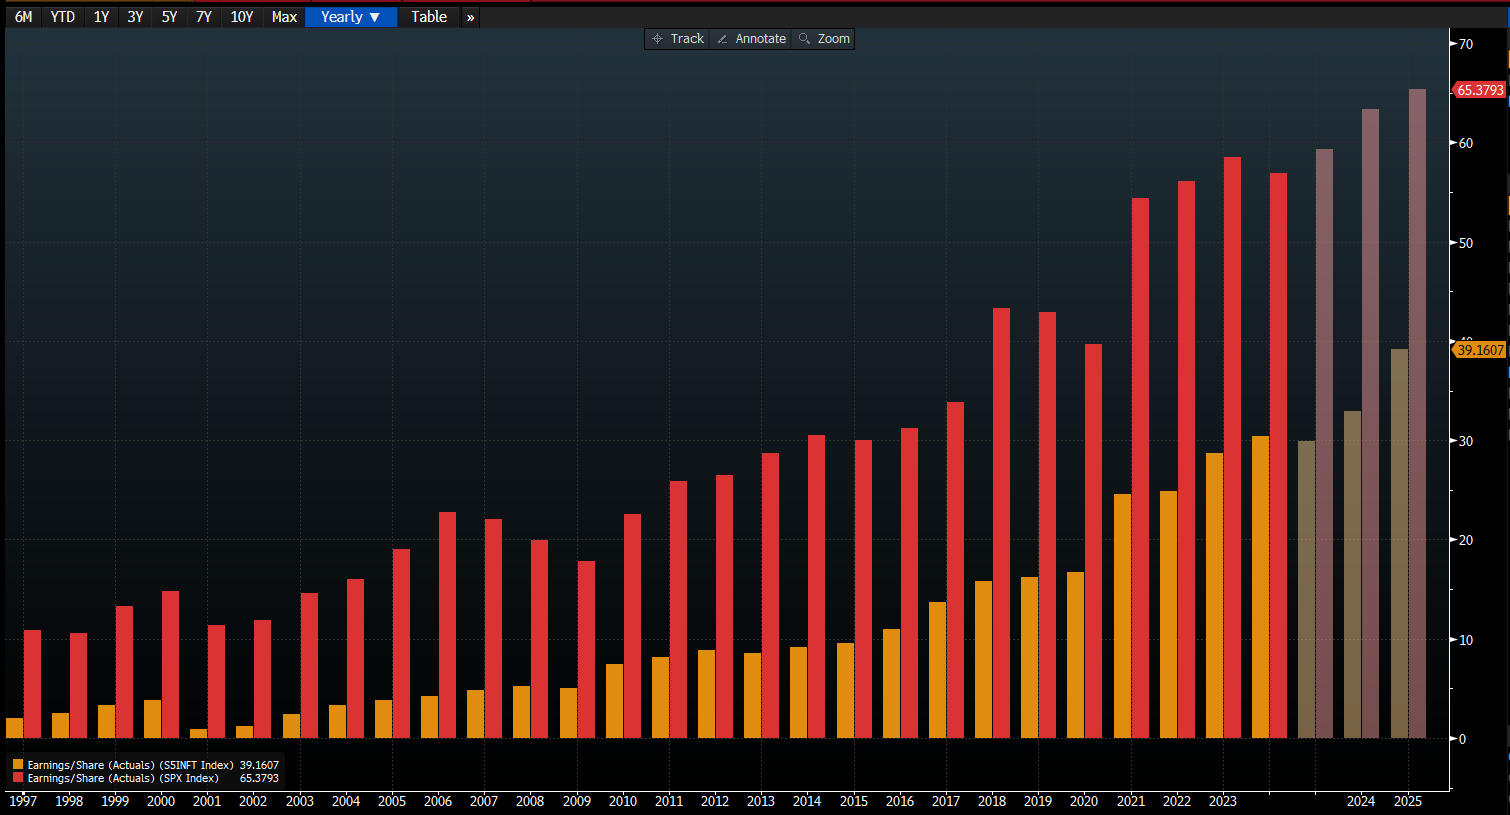
- S&P 500 Aggregate Annual Earnings per Share 1997-2024
- S&P 500 Info Tech Sector Aggregate Annual Earnings per Share 1997-2024
At the broadest level, speculative booms in Technology stocks often occur as new concepts capture our imaginations and call into question the prudence and wisdom of the past. AI is a new and powerful technology and may ultimately fit the description of a concept that calls our past prudence and wisdom into question, but at this point money is tracking earnings in a way that it is theorized to want to do. The question I keep coming to as I explore the big picture around this topic is one a very famous investor used to constantly ask of anyone around “is the good news priced in?”. With AI, in theory, there should be a pivot at some point. NVDA is the center of the AI nexus at present, viewed as the leader in making the “pick and shovels” that will bring all to the promised land of efficiency and profitability, but at some point, don’t the clients of this new technology stand to benefit enormously from its implementation.
At the beginning of this note we mentioned fireworks, beer, hamburgers and hot dogs, and of course Freedom. At some point the “Tech” needs to give us more of the good stuff that makes life special, fun and fulfilling. I think if we keep the “Why” of AI in mind, we will have a useful indicator of judging its value and measuring the endurance of its trend.
